Most beginner watchlists are too busy to be useful. They fill up with stocks that are “moving,” names in the news, and companies everyone is discussing online. That can feel like research, but it is usually just noise.
A good watchlist does something simpler: it helps you answer one question. What would make this business worth owning at the right price? Once you frame it that way, your focus shifts from daily price moves to business quality, cash generation, balance-sheet risk, valuation, and the few events that could actually change the thesis.
If you are building your first watchlist, start smaller than you think. For most people, 10 to 20 names is enough. That is enough to create opportunity, but still small enough to notice patterns in revenue, margins, management language, and valuation over time.
The point is not to track more stocks. It is to make better decisions with less distraction.
Build a watchlist to answer one question
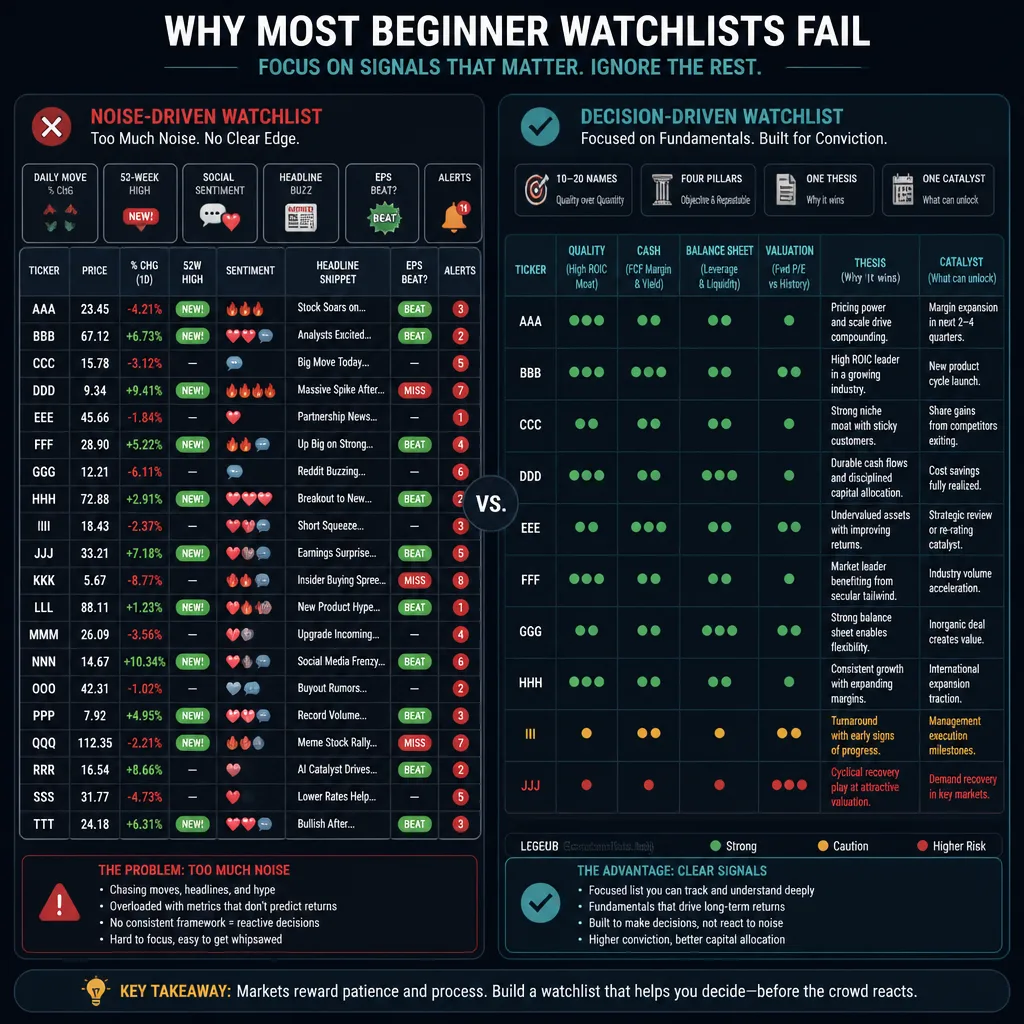
The biggest beginner mistake is confusing activity with analysis. Watching prices all day, reading posts, and reacting to every earnings headline can create the feeling of progress. It rarely creates understanding.
A useful watchlist is not a feed of interesting tickers. It is a decision tool. It should help you track four things:
- business quality
- cash reality
- financial resilience
- valuation and catalysts
If your watchlist is built around those four areas, it becomes much easier to avoid common beginner traps: buying a stock just because it has fallen, treating EPS as proof of quality, or paying for growth that is being funded by dilution or debt.
A practical limit matters. Ten to 20 names is usually enough for a first serious watchlist. A smaller list lets you learn a company’s reporting rhythm, how management sounds when conditions are improving or worsening, and what valuation range the market has historically assigned to the business. That kind of pattern recognition is more useful than following 60 stocks superficially.
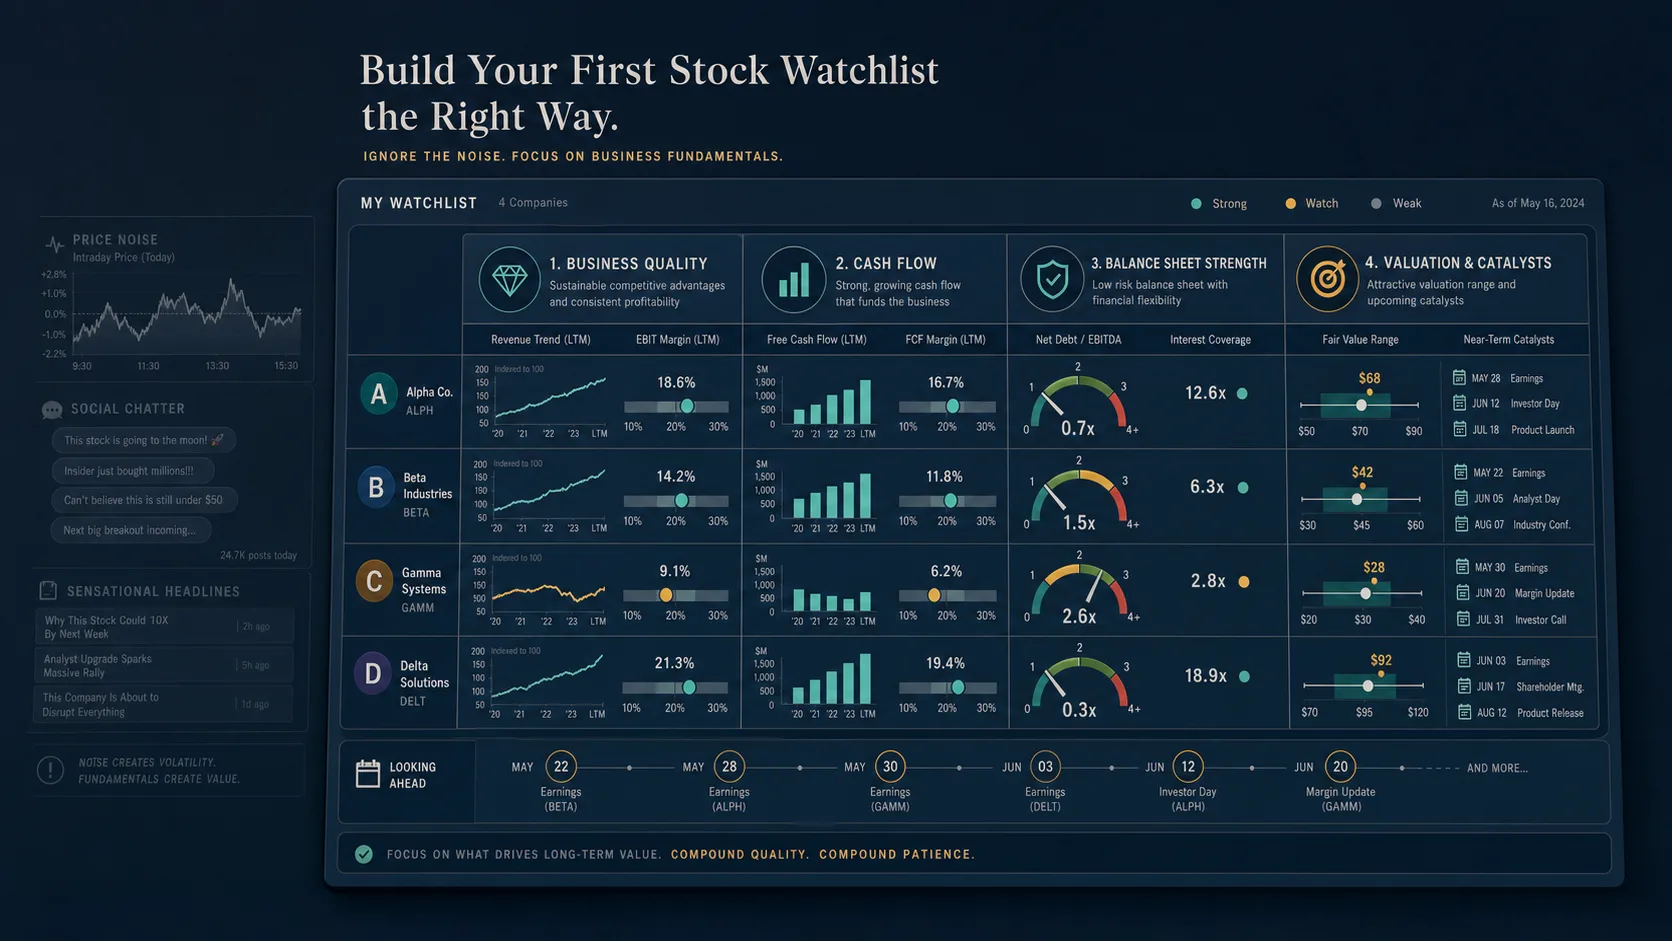
Start with the signals to ignore
Not everything visible is informative.
Daily price moves and 52-week chatter
A stock being down 8% does not tell you whether it is cheap. A stock near a 52-week high does not tell you whether it is expensive. For most beginner investors, those are prompts to investigate, not evidence on their own.
Headline narratives without numbers behind them
“AI winner.” “Turnaround story.” “Consumer recovery play.” These labels may contain some truth, but unless they show up in revenue, margins, orders, or cash flow, they are still just narratives.
Single-quarter EPS beats taken out of context
A company can beat EPS because of lower taxes, buybacks, cost cuts, or accounting adjustments. That does not always mean the business improved. If revenue is slowing, cash flow is weak, and share count is rising, the headline matters less than it seems.
Social sentiment as a substitute for analysis
Online sentiment can move prices for short periods. It cannot replace reading an earnings release, checking the cash flow statement, or reviewing debt maturities in SEC EDGAR. For a watchlist built to support decisions, sentiment is a weak input.
The 10 metrics that prevent beginner traps
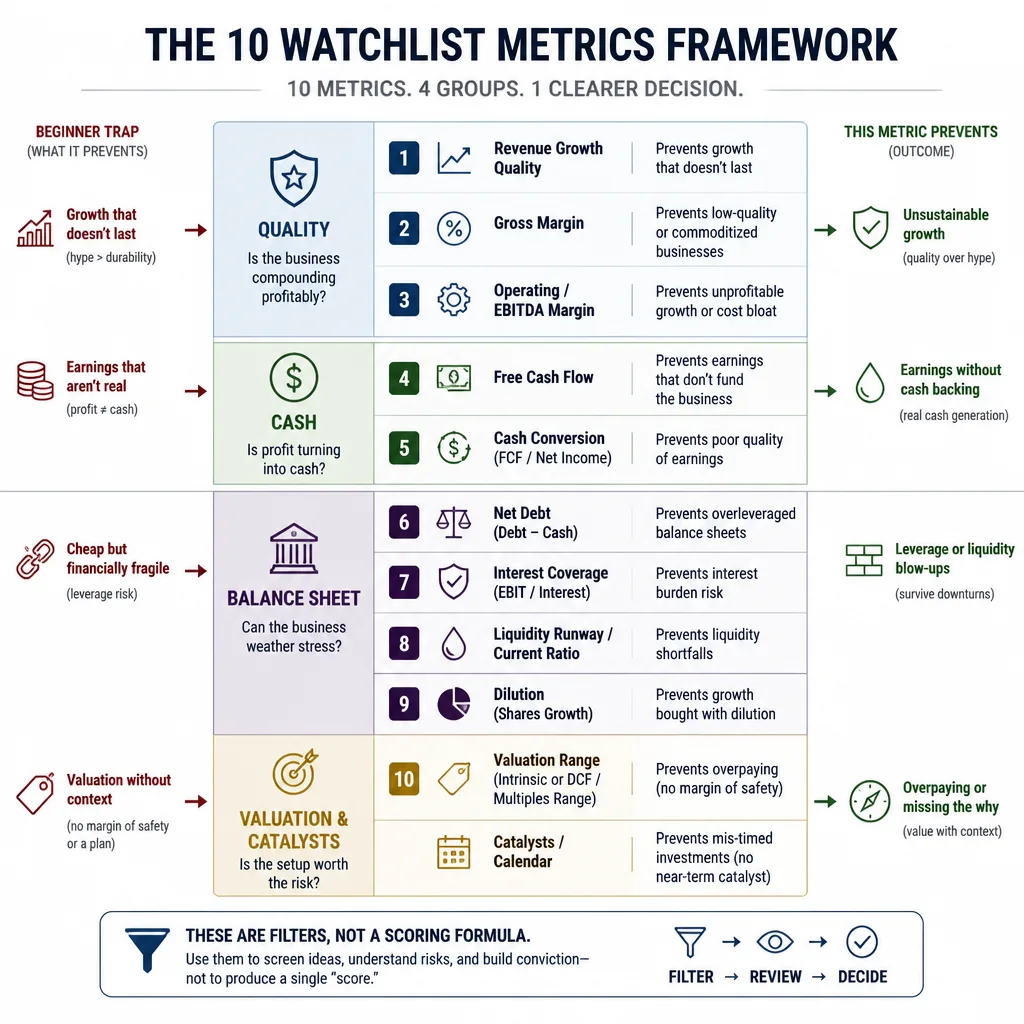
These metrics are not a formula for picking winners. They are filters that help you avoid bad reasoning.
1. Revenue growth quality
Revenue growth matters, but the quality of that growth matters more. Is it steady, accelerating, or slowing? Is it coming from price increases, acquisitions, discounting, or heavy sales spending?
A software company growing 25% can still be less attractive than one growing 18% if the faster growth comes with worsening losses and rising dilution.
2. Gross margin
Gross margin is a quick signal for pricing power, product mix, and competitive intensity. Rising gross margin can suggest stronger economics. Falling gross margin can point to discounting or cost pressure.
Context matters. A retailer will usually have lower gross margins than a software company. Compare a business against its own history and close peers, not against a universal standard.
3. Operating margin or EBITDA margin
This tells you whether management can turn gross profit into actual operating earnings. Revenue growth alone does not answer that.
If revenue rises each quarter but operating margin keeps shrinking, the business may not be scaling well. EBITDA can be useful, but be careful with capital-intensive businesses or companies with heavy stock-based compensation. In those cases, EBITDA can look cleaner than economic reality.
4. Free cash flow
Free cash flow is one of the best beginner metrics because it forces reality into the discussion. A business can report profits and still consume cash.
One quarter can be noisy because of seasonality or working-capital swings, so use a trailing-twelve-month view when possible. As a rule, a company that consistently generates free cash flow has more flexibility than one that relies on external funding.
5. Cash conversion
Compare net income with operating cash flow and free cash flow. If profits keep rising but cash does not, ask why.
Sometimes the reason is harmless timing. Sometimes it is not. A surge in receivables may mean customers are taking longer to pay. An inventory build may mean demand is weaker than management suggests. This is where many “good” earnings reports start to look less impressive.
6. Net debt and interest coverage
Net debt adjusts debt for the cash on the balance sheet. Interest coverage tells you how comfortably profits cover interest expense.
This matters most when conditions tighten. A stable industrial business may look cheap on earnings, but if debt is high and interest coverage is narrowing, refinancing risk can overwhelm the valuation case. Debt is not automatically bad, but it reduces room for error.
7. Current ratio or liquidity runway
For profitable businesses, a quick liquidity check helps you judge whether near-term obligations are manageable. For unprofitable growth companies, think in terms of runway: how long can current cash support current burn?
You do not need perfect precision. A rough estimate is often enough to tell whether a company has flexibility or may need to raise capital soon.
8. Share count dilution
This is one of the most overlooked beginner metrics. If share count rises every year, your ownership per share is shrinking.
A fast-growing company can still be investable with dilution, but you should understand the tradeoff. A business growing revenue 25% while share count rises 8% annually is not creating the same per-share value that the headline growth suggests.
9. Valuation range
Do not stop at “the P/E is 28” or “the EV/sales multiple is 6x.” The better question is whether that is high or low relative to the company’s own history, current growth rate, margin profile, and market regime.
There is no permanent correct multiple. Rate conditions, cyclicality, and confidence in future growth all matter. Track valuation as a range, not a verdict.
10. Catalysts and calendar
A watchlist should include the few upcoming events that could confirm or break your view. Earnings dates, guidance updates, product launches, investor days, regulatory decisions, buybacks, acquisitions, or debt refinancing can all matter.
The point is not to trade every event. It is to know when new evidence is likely to arrive.
A simple framework beginners can actually maintain
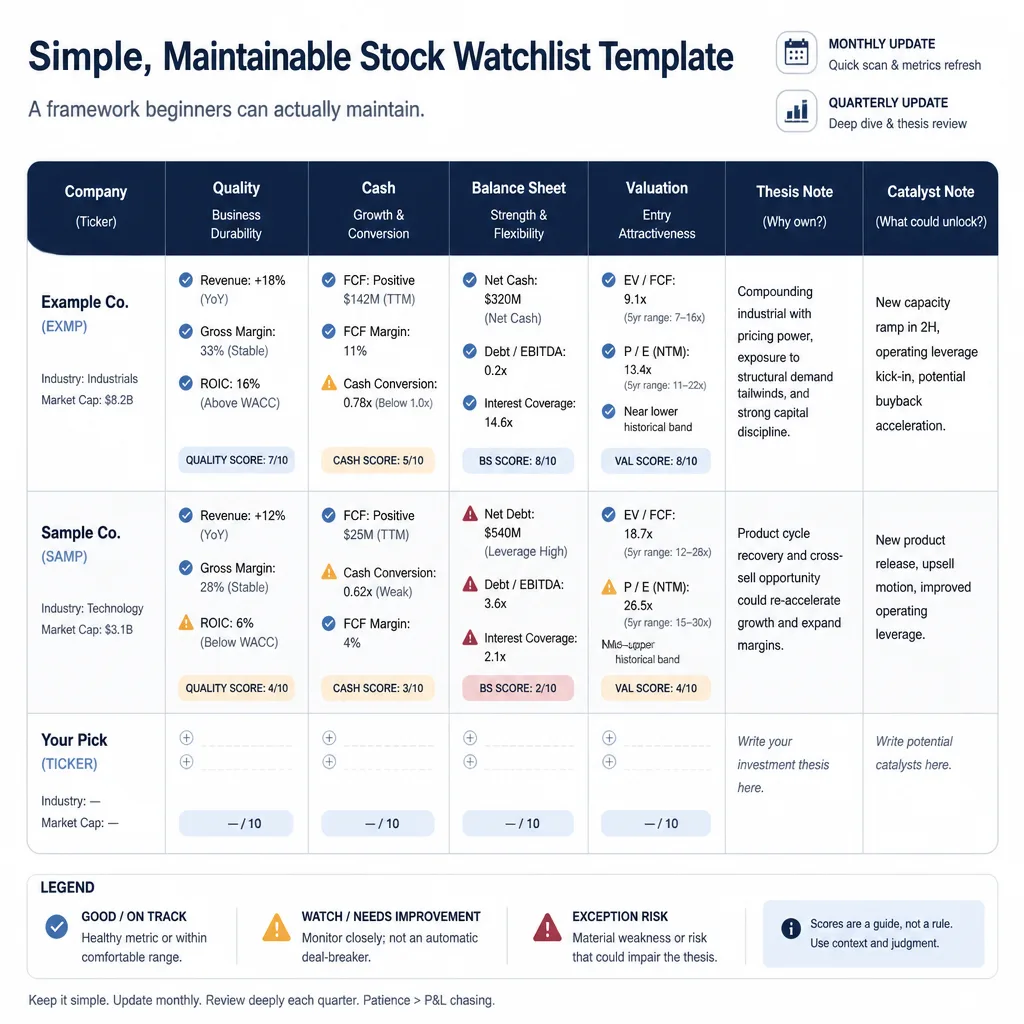
Most watchlists become unmanageable because they try to track everything.
A better setup uses four columns:
| Company | Quality | Cash | Balance Sheet | Valuation |
|---|---|---|---|---|
| Example Co. | Rev +18%, GM stable, Op margin improving | FCF positive, cash conversion solid | Net cash, dilution low | Near low end of historical range |
Then add two short note fields:
- Thesis note: what would make this worth owning?
- Catalyst note: what event could change your mind next?
That is enough.
In practice, your four buckets should hold:
- Quality: revenue trend, gross margin, operating margin
- Cash: free cash flow, cash conversion
- Balance sheet: net debt, interest coverage, liquidity, dilution
- Valuation: current multiple versus historical range
Color-code only exceptions. Red for rising dilution. Yellow for weakening cash conversion. Orange for refinancing risk. If everything is highlighted, nothing stands out.
A simple monthly scan plus a deeper quarterly update after earnings is usually sufficient. More frequent updates often turn into maintenance theater.
How to use filings and earnings calls without making this a full-time job
Use primary sources first: the company’s investor-relations page, the earnings release, and filings on SEC EDGAR. If you want a basic refresher on filings and investor protections, Investor.gov is also useful.
What to pull from the 10-K and 10-Q first
Do not start in the footnotes unless something looks odd. Start with:
- income statement
- cash flow statement
- balance sheet
- management’s discussion and analysis
- debt and share-count notes, if relevant
You are looking for trend changes, not accounting mastery.
How to read the earnings release before the transcript
The earnings release usually gives you the key numbers faster: revenue, margins, cash flow, segment performance, and guidance. Read that first. Then check whether the transcript adds anything meaningful.
Which management comments matter most
Pay closest attention to comments about:
- demand and order trends
- pricing and margin drivers
- expense discipline
- capital allocation
- balance-sheet changes
- forward guidance
These are the areas where story meets evidence.
When to distrust management framing
Be skeptical when adjusted profit rises but free cash flow weakens. Be skeptical when revenue grows but receivables or inventory surge. Be skeptical when “temporary” margin pressure shows up every quarter.
Management commentary is useful context. It is not a substitute for the statements.
How metrics should change by company type
The same template works across sectors, but the emphasis should shift.
High-growth companies
Focus more on gross margin quality, burn rate, dilution, and whether there is a believable path to operating leverage. A fast-growing business with strong gross margins may still be attractive if losses are narrowing and dilution is controlled. If losses deepen and share count keeps climbing, the burden of proof gets much higher.
Mature companies
Here, free cash flow durability, debt, capital allocation, and valuation discipline matter more. A slow-growing but cash-generative business can be a good candidate if the balance sheet is sound and the valuation leaves room for disappointment.
Cyclical businesses
One good quarter can mislead you badly near the top of a cycle. For cyclicals, normalized margins and balance-sheet strength matter more than headline momentum. Ask what earnings look like in a normal year, not just in the current one.
When a stock moves from watchlist to buy candidate
A stock becomes actionable when three conditions line up.
First, the thesis is still intact. The business quality, financial position, or strategic direction has not broken your original reasoning.
Second, valuation is attractive relative to the risks. Not just lower than last month, but attractive in the context of history, quality, and uncertainty.
Third, some catalyst or changing condition improves the risk-reward. That might be stabilizing margins, better cash conversion, a debt overhang clearing, or an overreaction to a quarter that did not actually break the business.
A stock should come off the watchlist when the thesis breaks, dilution changes the per-share story, governance or accounting concerns emerge, or a better idea takes its place on your limited list.
Build a watchlist that makes you calmer, not busier
The best first watchlist is not the one with the most names or alerts. It is the one that helps you see businesses more clearly.
If you remember one thing, make it this: a watchlist should reduce bad decisions, not increase stimulation. Track revenue quality, margins, cash flow, balance-sheet risk, dilution, valuation, and catalysts. Ignore most of the noise around them.
That approach will not guarantee good investments. Nothing does. But it will give you a better filter for deciding what deserves your time, what deserves patience, and what never deserved a place on your screen in the first place.
FAQ
What should a beginner stock watchlist be designed to do?
A beginner stock watchlist should function as a decision tool, not a stream of interesting tickers. Its job is to help you track what would make a business worth owning: business quality, cash generation, balance-sheet risk, valuation, and upcoming catalysts.
How many stocks should be on a first watchlist?
For most beginners, 10 to 20 names is enough. A smaller list makes it easier to spot revenue trends, margin changes, management credibility, and valuation ranges over time. A larger list often creates activity without deeper understanding.
What signals should beginners ignore when building a watchlist?
Beginners should usually de-emphasize daily price moves, 52-week high or low chatter, social-media narratives, and isolated EPS beats. Those signals can be prompts to investigate, but they are weak substitutes for understanding the business itself.
Which metrics matter most for a beginner watchlist?
The most useful metrics are revenue growth quality, gross margin, operating or EBITDA margin, free cash flow, cash conversion, net debt, interest coverage, liquidity, share count dilution, valuation range, and upcoming catalysts. Together, they help you assess business quality, financial resilience, and risk-reward.
Why does free cash flow matter more than a simple earnings beat?
Free cash flow shows whether profits are turning into real cash after the business funds its operating and capital needs. A company can post a headline earnings beat while still showing weak cash generation, rising working-capital pressure, or poor capital intensity.
How can beginners quickly spot debt risk?
A practical shortcut is to look at net debt, interest coverage, and near-term liquidity. Net debt shows leverage after accounting for cash, interest coverage shows how comfortably earnings cover financing costs, and liquidity helps you judge whether the company can handle pressure without raising capital.
Why is dilution an important watchlist metric?
Dilution matters because a rising share count reduces your ownership per share over time. Even if revenue or adjusted earnings grow, the value to each shareholder can weaken if stock-based compensation, equity issuance, or stock-funded acquisitions keep expanding the share base.
How should valuation be tracked on a watchlist?
Valuation should be tracked as a range, not a single number. Compare the current multiple with the company’s own history, current growth, margin profile, business quality, and market conditions. There is no universal correct multiple across sectors or rate environments.
What sources should investors use for watchlist research?
Start with primary sources such as SEC filings on SEC EDGAR, official investor-relations pages, earnings releases, and presentation decks. For U.S. investors, Investor.gov is also useful for basic education. These sources are usually more reliable than commentary or social posts.
How often should a watchlist be updated?
A simple rhythm works best: a quick monthly review for valuation and calendar items, then a deeper update after each quarterly earnings report. You can also revisit a name when a major event changes the thesis, such as a guidance cut, refinancing issue, product launch, or acquisition.
How do metrics change for growth stocks versus mature businesses?
For growth companies, focus more on gross margin quality, cash burn, dilution, and whether there is a credible path to operating leverage. For mature businesses, free cash flow durability, debt levels, capital allocation, and valuation discipline usually matter more.
When should a stock move from watchlist to buy candidate?
A stock becomes a buy candidate when three things line up: the original thesis still holds, valuation becomes attractive relative to quality and risk, and a catalyst or changing condition improves the expected risk-reward. No single metric should trigger a buy on its own.