Multipolar Investing Playbook: Map Geopolitics to Sector Exposure You Can Actually Buy
“Multipolar world” is one of those phrases investors hear constantly and define loosely. It usually refers to some mix of friend-shoring, industrial policy, energy security, export controls, and a more fragmented trading system. The problem is that none of that is investable by itself.
What matters is whether the shift reaches earnings. Does it change order books, loan growth, power demand, regulated asset bases, utilization rates, or pricing power? If not, it may be an interesting macro story, but it is not yet a portfolio idea.
That is the useful version of multipolar investing: not “which country has the best narrative,” but “which listed sector captures the profit pool.” This is where many investors get it wrong. They buy a country ETF or broad commodity exposure when the real beneficiaries may be banks, utilities, logistics operators, or a narrow industrial subsector.
A better lens is simple: Catalyst -> Transmission -> Listed Exposure. If you can trace the path from geopolitical change to earnings sensitivity, you have something you can own, monitor, and exit with discipline.[^1][^2]
Multipolarity matters only when it reaches earnings
Why geopolitical narratives often fail as investment theses
Geopolitical narratives usually fail because they stop at the first-order story. “Reshoring will help country X.” “Energy security is bullish for country Y.” “Industrial policy supports domestic manufacturing.” All of those claims may be directionally true. None tells you where shareholder returns will show up.
That matters even more now because industrial policy is no longer unusual. The IMF noted in April 2024 that there were more than 2,500 industrial policy interventions worldwide in the prior year alone.[^3] By May 2026, the IMF and the New Industrial Policy Observatory said tracked interventions had risen to more than 52,000 across 75 countries since 2009, with 2025 introductions running about 2.5 times the pre-pandemic average.[^4] Policy activism is everywhere. If every country has a national-champion story, the narrative itself stops being an edge.
The second problem is that policy activity and shareholder capture are not the same thing. Subsidies can be competed away. Financing can flow to unlisted firms. Higher activity can lift volumes without lifting margins. And in many cases, the best beneficiaries sit in regulated or second-order sectors rather than the headline industry.[^3][^4]
The core lens: transmission channels, not headlines
A multipolar thesis becomes actionable only when you can answer three questions:
- Who gets the orders?
- Who finances the buildout?
- Who serves the added power and infrastructure demand?
That is the bridge from geopolitics to sector exposure. It moves the process away from slogans and toward observable earnings channels.
A simple framework: from geopolitical driver to sector exposure
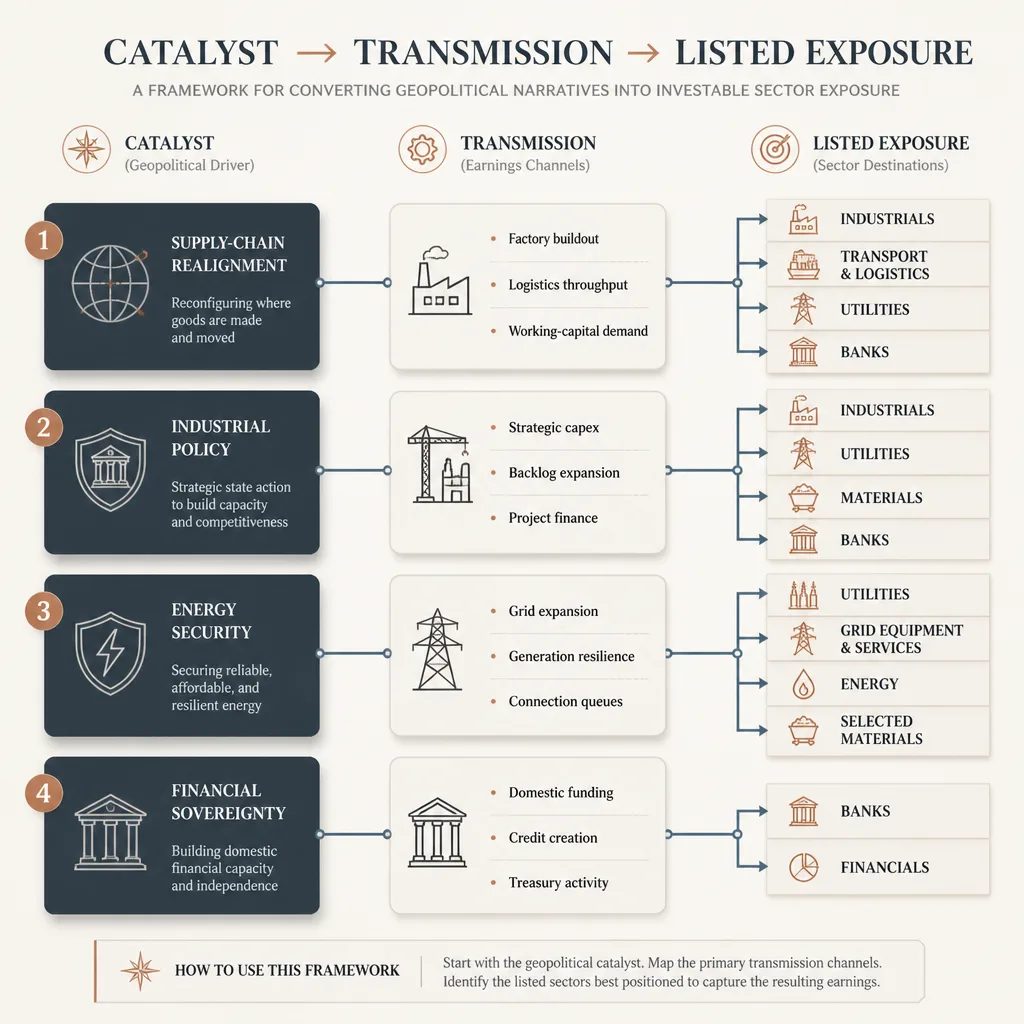
Driver 1: Supply-chain realignment
Near-shoring, friend-shoring, and reshoring can redirect investment flows, but the listed winners depend on where a country sits in the value chain and what is actually listed in its public markets. World Bank work on FDI relocations and supply-chain shifts makes this clear: relocation is not one uniform process, and countries benefit differently depending on industrial depth, logistics capacity, and integration into production networks.[^5]
In practice, supply-chain realignment often shows up first in factory announcements, industrial parks, logistics volumes, and working-capital demand. That can make industrials, transport, utilities, or banks better expressions than a broad national equity index.
Driver 2: Industrial policy and strategic capex
Industrial policy can create real spending cycles. It can support semiconductors, grid equipment, defense inputs, low-carbon manufacturing, or critical-mineral processing. But the IMF’s recent work is useful precisely because it is skeptical. Industrial policy is widespread, but difficult to implement effectively, and often produces modest gains relative to broader structural reforms.[^3][^4]
For investors, the key question is not whether policy exists. It is whether the policy creates a measurable capex cycle that listed companies can monetize through backlog, project conversion, margins, or financing volumes.
Driver 3: Energy security and power-system resilience
Energy security is no longer just an upstream oil and gas story. In many markets, the real constraint is grid capacity, interconnection, reliability, and the ability to connect new industrial load. The IEA’s Electricity 2026 says lack of grid capacity is becoming a critical bottleneck, with connection queues reaching record levels in many regions.[^6] Its 2025 commentary on congestion makes the same point: the issue is often not electricity demand, but the ability to move power where and when it is needed.[^7]
That changes the investable map. The cleaner expression may be regulated utilities, grid equipment, or power infrastructure rather than broad fuel exposure.
Driver 4: Financial sovereignty, credit creation, and domestic funding
This is one of the least discussed channels, and often one of the most important. If a geopolitical shift triggers a domestic investment boom, someone has to fund factories, warehouses, equipment, and working capital. In bank-led systems, that can make banks a cleaner and earlier earnings beneficiary than manufacturers themselves.
This is especially true when local listed manufacturers are limited, private, or structurally low-margin, while domestic lenders can grow commercial books, fee income, and deposits alongside the investment cycle.
The transmission map: which sectors usually carry the earnings sensitivity
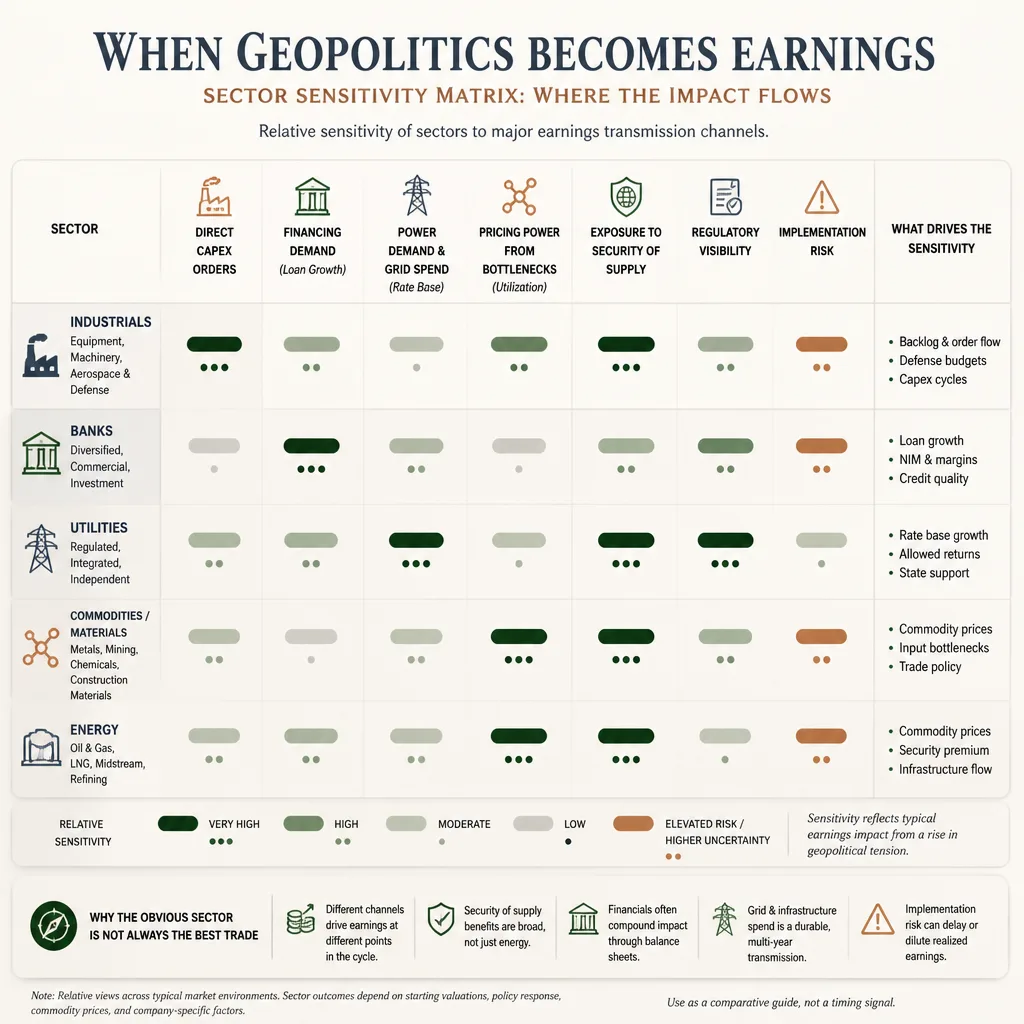
Industrials: direct capex and order-book beneficiaries
Industrials are the obvious beneficiaries when the transmission channel is equipment orders, automation, logistics systems, engineering, or project execution. The best evidence usually appears in book-to-bill, backlog, and capacity utilization, not in policy speeches.
But industrials are not always the best trade. If competition is intense or labor and input costs rise faster than prices, revenue can grow while margins disappoint.
Banks: indirect beneficiaries when investment booms require financing
Banks are classic second-order beneficiaries. They win when reshoring or strategic capex expands commercial lending, trade finance, treasury activity, and deposits.
This is why a “factory boom” does not always mean “buy manufacturers.” In some markets, the real listed profit pool sits with lenders financing industrial land, plant construction, equipment purchases, and working capital. The risk is just as clear: if projects stall, credit quality can deteriorate before the headline narrative fully breaks.
Utilities: power demand, grid spending, and regulated return profiles
Utilities become attractive when the key bottleneck is power delivery rather than commodity supply. They are often less exciting than industrials, but more measurable. PSEG said in its 2025 results release that PSE&G’s 2026-2030 capital plan is expected to drive compound annual rate-base growth of 6% to 7.5%, starting from a roughly $36 billion year-end 2025 base.[^8] That is a good example of how infrastructure investment can translate into steady, visible earnings rather than explosive upside.
AES’s 2025 annual report disclosed a 12.0 GW backlog of signed-but-not-yet-operational projects, including 5.7 GW under construction, while also highlighting regulatory activity at AES Indiana and AES Ohio.[^9] The point is not the stock call. It is the accounting path: backlog, rate cases, load growth, and capital deployment.
Commodities and materials: bottleneck pricing versus volume growth
Materials exposure works best when the country or company controls a choke point. The IEA said in 2025 that the average market share of the top three refining nations for key minerals rose to 86% in 2024 from around 82% in 2020.[^10] That supports a bottleneck framework.
But investors should distinguish volume growth from pricing power. A miner or processor benefits most when supply is scarce and hard to replace. If demand weakens or governments intervene aggressively, strategic importance may not translate into durable shareholder returns.
Energy: when security of supply matters more than headline demand
Sometimes energy security does favor upstream producers. But not automatically. In importer markets, the investable winners may be LNG infrastructure, pipelines, storage, utilities, or grid-heavy names. In resource-rich exporter markets, upstream and midstream exposure may be the cleaner expression.
When the best expression is not in the obvious sector
This is the core habit multipolar investors need to build: ask whether the thematic beneficiary and the listed beneficiary are actually the same. Very often they are not.
A country can be a reshoring winner while its best public-market expression is a bank. An energy-security winner may be better expressed through utilities than oil. Industrial policy can lift national output while listed equities lag because returns are capped, diluted, or competed away.[^4]
Why the same country story can lead to different trades
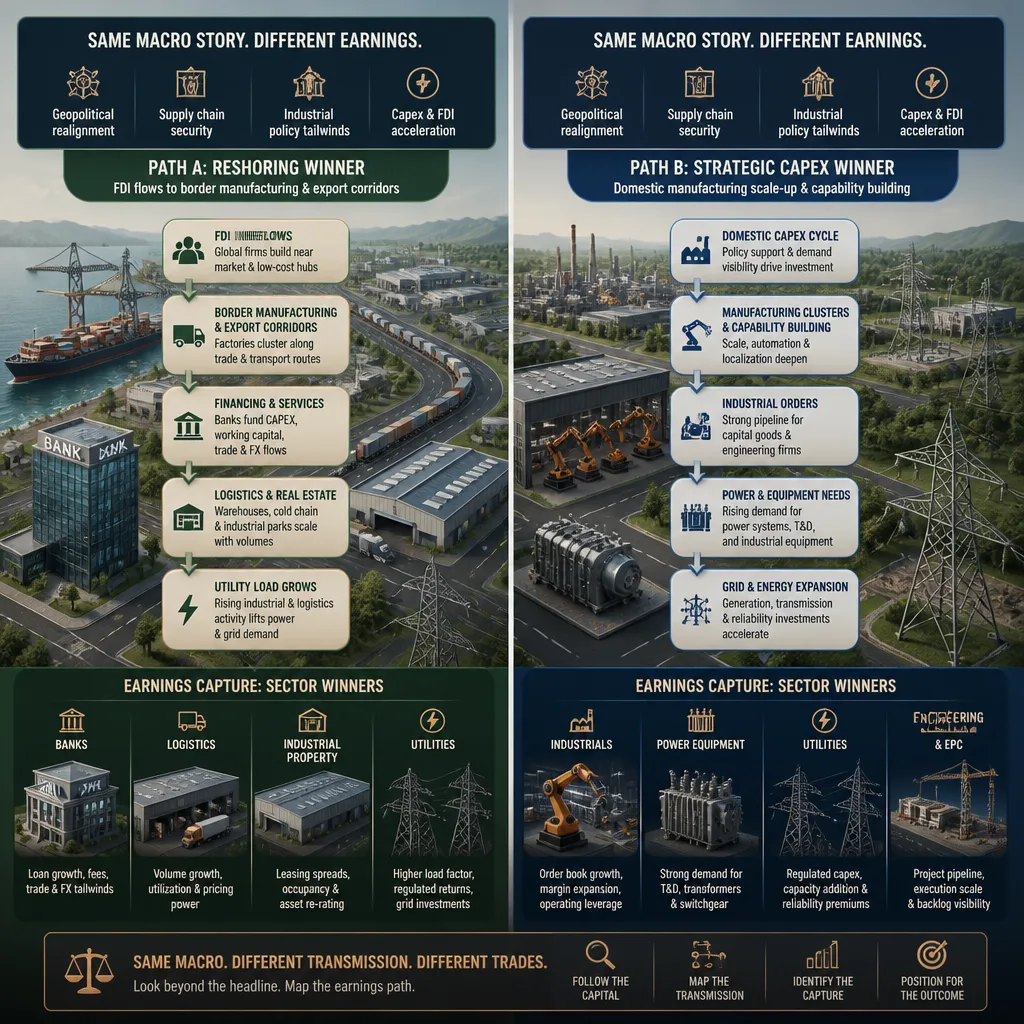
Country pair example 1: Two reshoring winners, but one favors banks and the other industrials
Take Mexico and India. Both are often framed as beneficiaries of supply-chain diversification. But the listed-market expression is not identical.
Mexico’s story often runs through North American manufacturing integration. Yet public-market capture can skew toward banks, airports, transport, industrial property, and utilities as FDI creates financing needs and infrastructure load, while many export manufacturers are subsidiaries of global firms or lower-margin assemblers. In that setup, the first dollar of profit may land in financing and enabling infrastructure rather than local manufacturing champions.[^5]
India can look different. There, strategic capex and domestic industrial buildout may be expressed more directly through industrials, power equipment, and utilities, with banks also participating but not always as the cleanest pure play. The difference comes down to market composition, domestic industrial depth, and where listed companies sit in the project chain.
Same narrative. Different earnings map.
Country pair example 2: Two energy-security stories, but one favors utilities and the other commodities
Now compare Germany and Canada.
Germany’s energy-security challenge is largely about securing affordable, reliable power for industry and improving system resilience. That tends to push the investable case toward utilities, grids, transmission, and power-enabling infrastructure. If the bottleneck is connection capacity and system reliability, utility-style exposures may capture the clearest earnings sensitivity.[^6][^7]
Canada, by contrast, can express parts of the same broad security narrative through upstream energy, LNG-linked infrastructure, and selected materials because it has resource leverage. Here, the profit pool may sit closer to production and export capability than to domestic grid buildout.
What decides the difference: market composition, policy design, and energy mix
Three factors usually decide the trade:
- Market composition: Are the relevant winners even listed?
- Policy design: Are returns competitive, subsidized, or regulated?
- Energy mix and constraints: Is the bottleneck fuel supply, grid capacity, or financing?
Those questions matter more than the geopolitical slogan.
A practical decision model investors can reuse
Use this four-step model.
Step 1: Identify the geopolitical catalyst
Be specific. “Multipolarity” is too broad. “US-China supply-chain diversification into North America” is usable. “European power-security capex” is usable.
Step 2: Ask who gets the revenue, financing, and power demand
This is the core filter. If new factories are announced, who sells the equipment? Who lends the money? Who has to expand the grid or generation base?
Step 3: Test whether the market has listed vehicles that actually capture the thesis
This is where country ETFs often fail. The index may be dominated by unrelated sectors. Sometimes a sector ETF, ADR, domestic listing, or even a commodity proxy is cleaner than broad country exposure.
Step 4: Check valuations, timing, and policy implementation risk
A correct theme can still be a poor investment if it is already crowded. For banks, price-to-book and credit-cycle assumptions matter. For utilities, upside may be visible but capped. For industrials, backlog quality and margin conversion matter more than headline order growth.
What to monitor after putting on the trade
The monitoring list should stay practical.
Leading indicators: FDI, factory announcements, grid investment, loan growth, power prices
Watch for announced and confirmed FDI, industrial-park activity, transmission plans, interconnection queues, business loan growth, and industrial power prices. These help show whether the thesis is moving from policy language into real economic activity.[^5][^6][^7]
Earnings indicators: backlog, margins, utilization, regulated asset-base growth, credit quality
For industrials, watch backlog conversion and margins. For banks, commercial loan growth and credit quality. For utilities, rate-base growth and capital-plan execution. Ameresco’s first-quarter 2026 reporting, for example, showed total project backlog of $5.27 billion, O&M backlog of $1.54 billion, and assets in development estimated at $2.0 billion.[^11] That is exactly the kind of evidence investors should prefer over broad thematic commentary.
Disconfirming signals: project delays, subsidy dilution, energy cost spikes, weak domestic demand
If power costs rise enough to damage competitiveness, if grid connections are delayed, if subsidies are watered down, or if loan growth arrives without healthy credit quality, the transmission channel may be weaker than the narrative suggests.
Where multipolar investing goes wrong
Narrative crowding and valuation risk
The more obvious the theme, the more likely it is already in the price. Industrial policy and reshoring are now consensus topics, not hidden insights.[^3][^4]
Mistaking policy ambition for execution
Governments announce far more than they successfully implement. The IMF’s caution on industrial policy matters here: intervention is common; effective execution is much harder.[^4]
Using country exposure when sector exposure is cleaner
Country beta often dilutes the thesis. If the catalyst maps cleanly to banks or utilities, broad market exposure may add noise without improving upside.
Confusing correlation with causation in post-announcement rallies
A stock can rally on a policy announcement without any durable earnings impact. Treat announcement rallies as hypotheses, not proof.
Conclusion
The useful rule for multipolar investing is simple: invest the transmission channel, not the slogan.
Geopolitical fragmentation, reshoring, industrial policy, and energy security all matter. But they matter to investors only when they show up in something measurable: orders, loans, grid capex, regulated asset growth, utilization, or pricing power. That is the difference between a compelling story and a repeatable investment process.
The strongest trade is often not the country with the loudest geopolitical narrative. It is the sector with the clearest profit capture and the cleanest listed exposure. Start with the catalyst, trace the transmission, then test whether public markets actually let you own it.
FAQ
What is multipolar investing?
Multipolar investing is an approach that translates geopolitical fragmentation, friend-shoring, industrial policy, and energy security into investable market exposure. The key is not the headline narrative itself, but which listed sectors actually capture the resulting earnings, financing demand, power demand, or pricing power.
Why is sector exposure often better than a country-level bet in a multipolar world?
Because the same geopolitical story can flow through different profit channels. A country may benefit from reshoring, for example, but listed returns might accrue more to banks, utilities, transport firms, or industrial parks than to manufacturers. Country ETFs can dilute the thesis if the index is dominated by sectors unrelated to the catalyst.
How do I map geopolitics to sector exposure?
Use a simple sequence: identify the catalyst, trace the transmission channel, then find the listed exposure. In practice, ask who gets the orders, who finances the buildout, who serves the added power demand, and where pricing power or regulation allows profits to show up in earnings.
Which sectors tend to benefit most from supply-chain realignment?
It depends on market structure, but common beneficiaries include industrials that receive equipment or logistics orders, banks that finance factory and working-capital expansion, utilities that support rising power demand, and selected transport or infrastructure operators. Materials can benefit too, but only if volumes or bottleneck pricing improve.
How does industrial policy show up in earnings?
Industrial policy usually shows up through backlog growth, project pipelines, capex cycles, commercial loan growth, regulated asset-base expansion, and sometimes pricing support in constrained segments. But policy support does not automatically become shareholder returns, since subsidies can be competed away through lower prices, higher costs, or capped regulation.
Does energy security always mean buying oil and gas stocks?
No. In many cases, the cleaner expression is utilities, grid equipment, power infrastructure, or selected materials rather than broad upstream energy. If the bottleneck is power delivery, interconnection, storage, or grid resilience, fuels may be less directly exposed than the companies enabling reliable electricity supply.
Why can two countries share the same narrative but lead to different trades?
Because listed-market composition, domestic financing systems, energy mix, and policy design differ. Two countries can both benefit from reshoring or energy security, yet one may express it through banks and utilities while the other expresses it through industrial exporters or commodity producers.
What indicators should investors monitor after putting on a multipolar trade?
Useful signals include FDI announcements, factory commitments, industrial-park activity, grid investment plans, interconnection queues, power prices, commercial loan growth, backlog trends, utilization rates, margins, regulated asset-base growth, and credit quality. These indicators help confirm whether the geopolitical thesis is actually reaching earnings.
What are the main risks in multipolar investing?
The biggest risks are narrative crowding, overpaying for obvious themes, confusing policy ambition with execution, choosing the wrong listed vehicle, and mistaking announcement rallies for durable profit growth. A theme can be directionally right while the chosen sector still underperforms.
What is the core rule of a multipolar investing playbook?
Invest the transmission channel, not the slogan. The best trade is often not the country with the strongest geopolitical story, but the sector with the clearest and most measurable earnings sensitivity.