Open-Source Research Workflow for Global Investing: Build a Country ETF, FX, and Macro Tracker with OpenBB
Most investors do not lack information. They lack a reliable way to compare it.
That problem gets worse as soon as you move beyond your home market. India can look strong, Vietnam can look messy, Indonesia can look cheap, and Mexico can look resilient. But for a USD-based investor, the ETF chart is only part of the picture. Realized returns reflect equity exposure, currency moves, the macro backdrop, and whatever catalyst shifts the narrative next.
That is the real use case for a country research workflow. Not more tabs. Not more dashboards. A repeatable way to ask the same questions across unfamiliar markets so you can compare them without fooling yourself.
Using OpenBB’s Python reference, you can build a lightweight tracker around a small set of functions: historical ETF prices, FX history, country profiles, economic calendars, and ETF exposure checks.[^1][^2][^3][^4][^5] The goal is not to imitate a macro desk. It is to standardize how you compare country opportunities such as India, Vietnam, Indonesia, and Mexico.
Why this workflow matters
Country investing breaks when price, FX, and macro are viewed separately
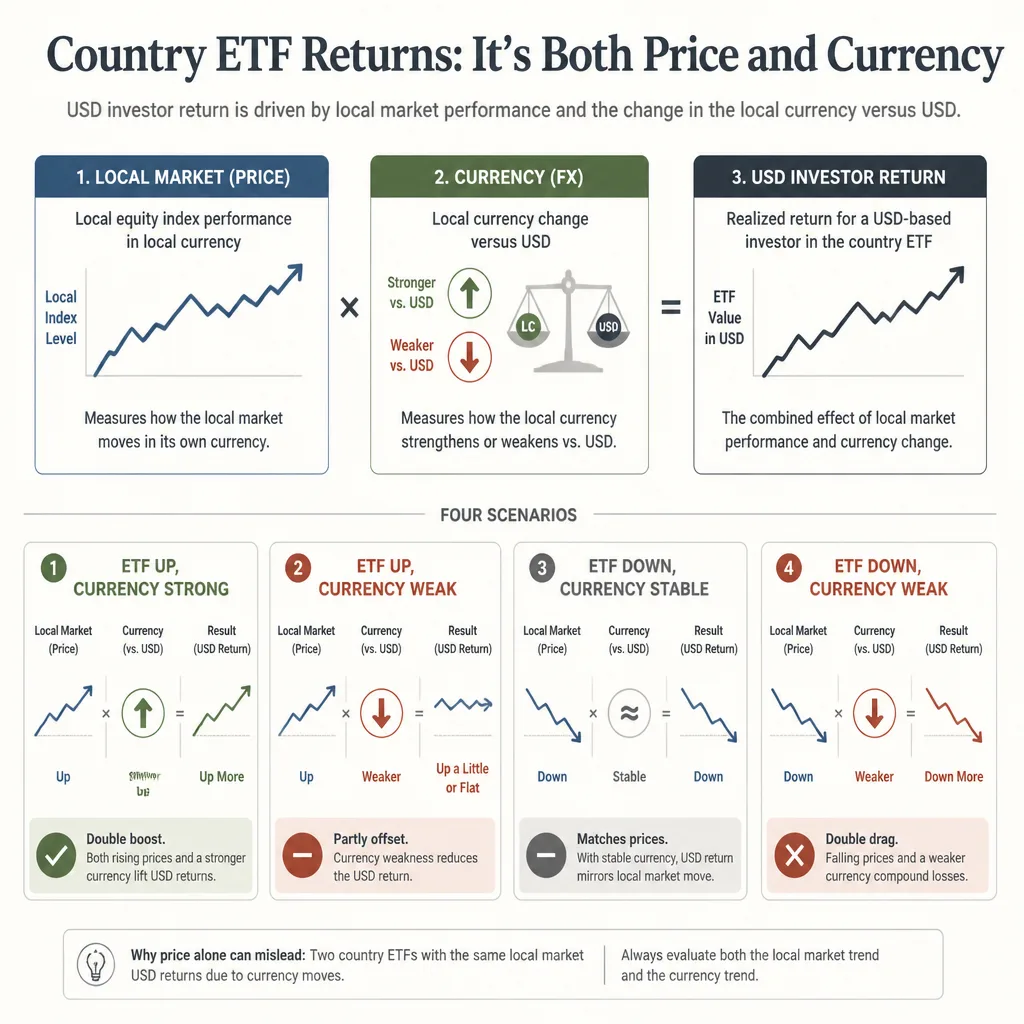
A country ETF is a useful proxy, but it compresses several forces into one signal. If you only watch price, you can miss what is actually driving the move.
A local market may be holding up while the currency weakens enough to drag down returns for a USD investor. The reverse can happen too. Weak local sentiment can be partly offset by a stabilizing currency or a broad risk-on environment. That is why ETF performance without FX context is incomplete.
Macro matters for the same reason. Inflation, rates, growth, and labor data are not background noise in emerging markets. They shape policy, capital flows, valuations, and risk appetite. OpenBB’s country_profile endpoint is useful here because it pulls indicators such as GDP growth, CPI, policy rate, 10-year yield, and unemployment into one view.[^1]
Standardization beats intuition in unfamiliar markets
When you know a market well, intuition can reflect real context. When you do not, intuition is often recency bias with better branding.
A better system asks the same four questions every time:
- What is the best liquid market proxy?
- What is the currency doing against USD?
- What macro regime is the country in?
- What events could change that regime next?
That alone will help you avoid many unforced errors.
What this tracker should answer
A practical country tracker should help you answer four things quickly:
- Proxy: What instrument are you actually using to express the view?
- Translation: Is FX helping or hurting returns?
- Regime: Is the macro backdrop improving, deteriorating, or mixed?
- Catalyst: What in the next one to two weeks could change the story?
This is why a small standardized tracker is often more useful than a sprawling dashboard. That is not a scientific law. It is a practical one. Systems people maintain usually beat systems people admire and abandon.
India, Vietnam, Indonesia, and Mexico make a useful test set because they are not interchangeable. India often attracts structural growth capital. Mexico is closely tied to North American manufacturing and trade. Indonesia is sensitive to both commodities and policy. Vietnam is attractive, but harder to proxy cleanly through a single ETF. That mix forces discipline.
Step 1: Define the market proxies first
Choose country ETF proxies, then note their limitations
A practical starter set is:
- India: INDA
- Vietnam: VNM
- Indonesia: EIDO
- Mexico: EWW
These funds currently exist on issuer pages and are commonly used as U.S.-listed country proxies.[^6][^7][^8][^9]
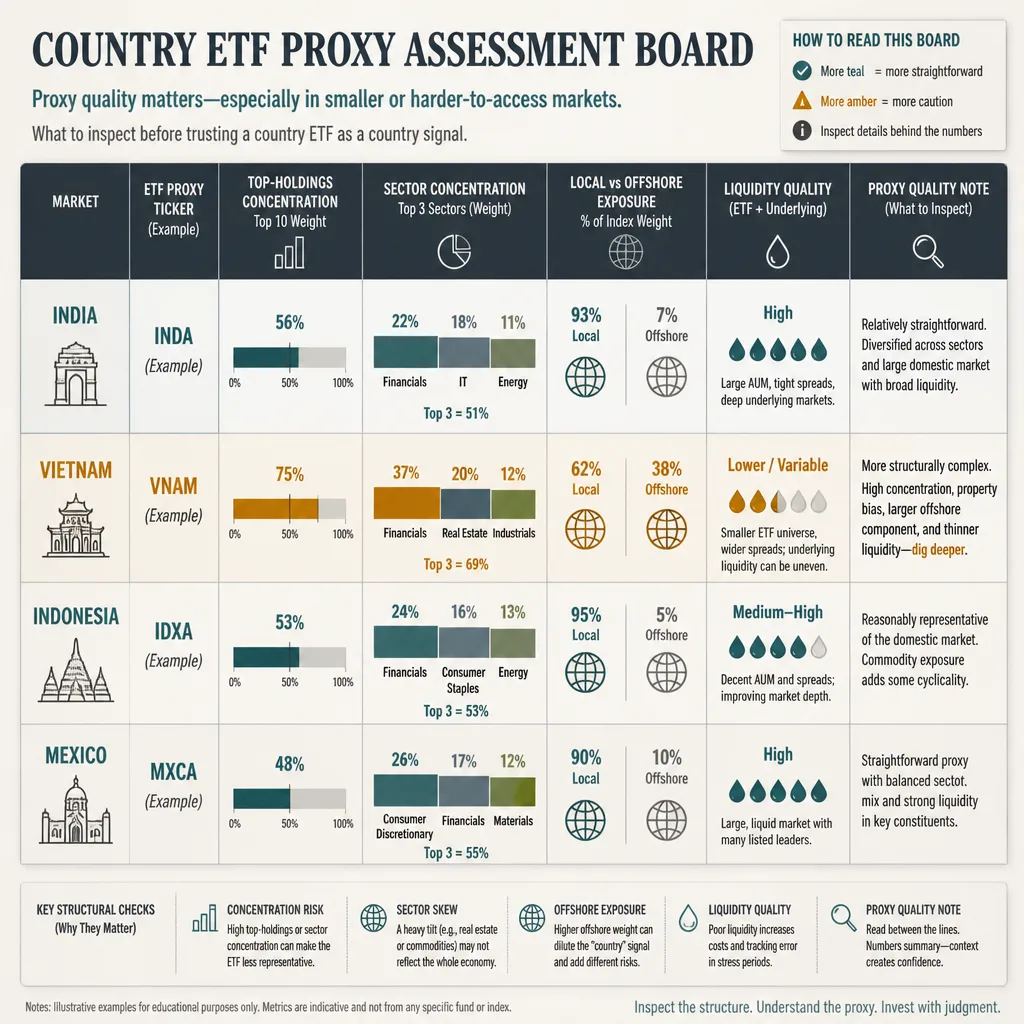
Still, existence is not the same as clean exposure. Vietnam is the obvious example. A Vietnam-focused ETF may still reflect access constraints, offshore listings, concentration, or index-design quirks. Treat proxies as screening tools first, not final truth.
Check what the ETF actually owns
Before treating any ETF as a country signal, check what it represents.
OpenBB documents obb.etf.countries() for ETF country weightings, which is a useful first pass when you want to confirm whether a fund is as country-pure as it appears.[^3] You can also use ETF info pages to review country focus, currency, and fund characteristics.[^10]
In practice, also review:
- top holdings concentration
- sector concentration
- whether the fund owns local listings, ADRs, or offshore vehicles
- whether liquidity matches your position size
Why proxy quality matters more in harder-to-access markets
For India, Indonesia, or Mexico, the proxy problem may be manageable. For Vietnam, it can become part of the thesis.
A distorted proxy can create false confidence. If the ETF is heavily skewed toward a handful of holdings or sectors, you may think you are buying a country when you are really buying one narrow slice of it.
Step 2: Build the price and FX layer
Track ETF returns in USD
OpenBB’s obb.equity.price.historical() gives you historical price data for ETFs and equities.[^11] That is enough to build a simple return panel across fixed windows such as 1 month, 3 months, 6 months, and 1 year.
You do not need a sophisticated model. You just need every proxy measured over the same windows.
Track the local currency against USD
Then pull FX history with obb.currency.price.historical().[^2] The docs support symbols such as EURUSD, and the same logic applies to country pairs depending on the provider’s symbol convention.[^2]
Consistency matters more than format. If you use USDINR, USDIDR, USDMXN, and USDVND, define the interpretation clearly: does a rising series mean USD strength or local-currency strength? Put that rule directly in the tracker so you do not have to remember it later.
Separate equity momentum from currency translation
This is the key mental model:
- ETF up, currency strong: the cleanest signal for a USD investor
- ETF up, currency weak: local equities may be stronger than realized returns suggest
- ETF down, currency stable or improving: possible early turn worth investigating
- ETF down, currency weak: weakness is broad, not isolated
This will not predict returns. It will, however, keep you from reading one chart as a full story.
Build a simple relative-performance panel
A useful panel only needs a few columns:
| Country | ETF | 1M ETF Return | 3M ETF Return | FX 1M | FX 3M | Signal Note |
|---|---|---|---|---|---|---|
| India | INDA | |||||
| Vietnam | VNM | |||||
| Indonesia | EIDO | |||||
| Mexico | EWW |
The last column matters more than it looks. It forces interpretation instead of passive collection.
Step 3: Add the macro regime layer
Start small
This is where many investors overbuild.
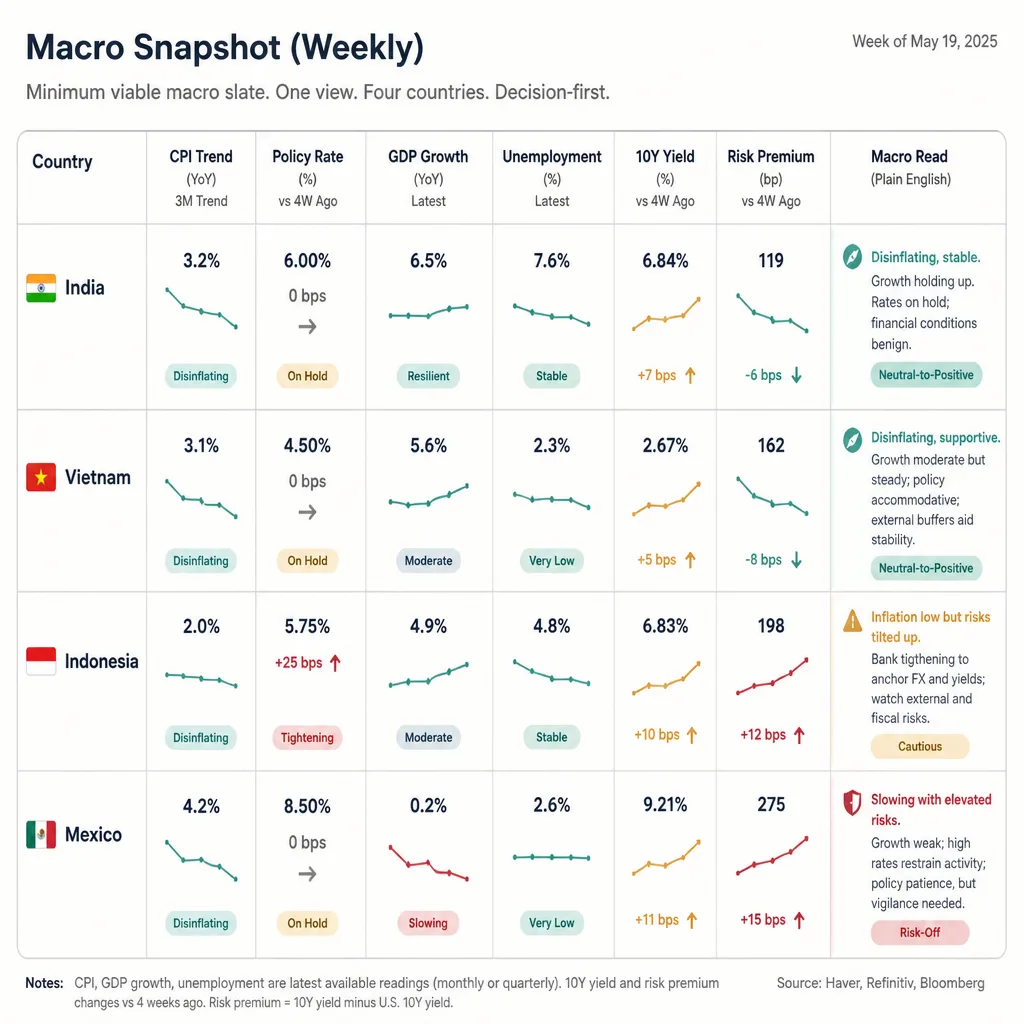
You do not need 20 indicators. For most self-directed investors, a minimum viable macro slate is enough:
- CPI or inflation trend
- policy rate
- GDP growth
- unemployment or jobless rate
- 10-year yield or long-rate proxy
- market risk premium, where available
OpenBB’s obb.economy.country_profile() is well suited to this because it documents many of those fields in one endpoint, including GDP, CPI, policy rate, 10-year yield, and jobless rate.[^1] OpenBB also documents obb.economy.interest_rates() for country-level rates, though coverage varies and some markets are patchier than others.[^12] The broader Economy reference also lists country risk-premium tools, which can extend the tracker where the data is usable.[^5]
Avoid indicator sprawl
Use a simple rule: if you cannot explain how an indicator would change your allocation decision, it probably does not belong in the weekly tracker.
A compact macro sheet is easier to maintain and easier to compare. That matters more than theoretical completeness.
Build a snapshot table, not a pile of charts
Use one row per country and one column per indicator:
| Country | CPI YoY | Policy Rate | GDP YoY | Jobless Rate | 10Y Yield | Macro Read |
|---|---|---|---|---|---|---|
| India | ||||||
| Vietnam | ||||||
| Indonesia | ||||||
| Mexico |
The Macro Read column should be plain English: disinflating, tightening, growth slowing, labor steady, yields elevated. That is more useful than pretending the sheet makes decisions by itself.
Step 4: Add event risk
Use the economic calendar to monitor catalysts
This is what makes the tracker forward-looking.
OpenBB’s obb.economy.calendar() is documented as a global economic calendar with country filters, importance filters, and event groups including inflation, interest rate, GDP, labour, trade, and business.[^4] That makes it a practical way to monitor the next 7 to 14 days of catalysts by market.
Focus on releases that can actually move the story
For country allocation work, prioritize:
- inflation
- central bank decisions
- GDP releases
- labor data
- trade data
- major government or business-confidence releases
These are the releases most likely to shift the regime investors are pricing.
Pair calendar data with headlines
OpenBB also documents a news.world endpoint, which can support a top-down headline layer.[^13] I would use this selectively unless you have already validated the exact filtering and workflow you want.
In practice, the headline tab can stay simple:
- major policy headlines
- election or regulatory developments
- trade and tariff changes
- market-moving company or banking stress
- one-line interpretation
This combination is what matters. Macro tables tell you what the backdrop is. Calendars and headlines tell you what could change next.
Step 5: Turn it into a weekly process
The Monday workflow
A good workflow should be boring enough to repeat.
A practical version looks like this:
- Refresh ETF prices.
- Refresh FX series.
- Update the macro snapshot.
- Pull the next 7 to 14 days of calendar events.
- Scan major country headlines.
- Write one sentence on what changed for each country.
That last sentence is the discipline mechanism. If you cannot summarize what changed, you probably do not understand it yet.
Use a simple scorecard
Track four buckets:
- Trend
- Currency
- Macro
- Catalyst
Mark each one as improving, worsening, or mixed. Do not overengineer the scoring. The point is triage, not precision.
Know when to escalate into deeper work
Escalate when signals conflict or begin to inflect.
Examples:
- ETF momentum is strong, but FX is deteriorating sharply
- inflation is cooling and the currency is stabilizing after a weak stretch
- calendar risk is heavy just as positioning looks crowded
- the proxy ETF is moving, but macro does not explain it
That is when you move from tracker mode into deeper country research.
A copyable tracker template
Suggested columns
At minimum, include:
| Country | ETF | Proxy Quality Note | 1M ETF | 3M ETF | 1M FX | 3M FX | CPI | Policy Rate | GDP | Jobless | 10Y Yield | Next Catalyst | Headline Note | Overall Read |
|---|
That is enough for most investors.
Suggested tabs
Keep the structure simple:
- Prices
- FX
- Macro Snapshot
- Calendar
- Headlines
- Notes
This is about the right level of complexity for a workflow you might actually maintain.
Optional automation
Only automate after the manual version proves useful.
Then you can:
- schedule notebook refreshes
- export updated tables weekly
- auto-populate return windows
- flag high-importance events in the next 7 days
- append one-line notes after each review cycle
The same documented OpenBB endpoints are enough to support that progression.[^1][^2][^4][^11]
Where this workflow can fail
ETF proxy distortions
This is the biggest limitation.
Single-country ETFs can be concentrated, sector-skewed, and imperfect representations of the local economy. That matters even more in smaller or less accessible markets such as Vietnam.[^9] Use the tracker for monitoring and comparison, not as proof that the investable opportunity is fully captured.
Macro data lag and revision risk
Macro data is often backward-looking. It gets revised. It can also miss what the market already priced.
That criticism is fair. But it does not make the macro layer useless. It means macro should be used for regime context and catalyst monitoring, not as a timing tool.
The danger of false precision
A clean scorecard can make a messy world look settled. It is not.
A strong workflow narrows your attention and improves comparisons. It does not replace valuation work, liquidity review, benchmark context, or security-level diligence.
Conclusion
A useful global investing workflow is not the one with the most charts. It is the one that makes differences across countries legible quickly enough to improve decisions.
If you are comparing India, Vietnam, Indonesia, and Mexico, start with the basics: a liquid ETF proxy, the currency against USD, a compact macro snapshot, and the next set of catalysts. OpenBB fits that workflow well because its documented endpoints cover the core pieces without forcing you into a heavyweight institutional stack.[^1][^2][^3][^4][^5]
That combination will not tell you what to buy on its own. It does something more valuable: it helps you avoid reading a country through one incomplete signal. In global investing, that alone can improve judgment.
FAQ
Why is a country ETF chart alone not enough for global investing?
Because a USD-based investor is exposed to both local equity performance and currency translation. A country ETF can look strong in local-market terms while FX weakness erodes returns for foreign investors. A better workflow tracks the ETF proxy, the currency, the macro backdrop, and upcoming catalysts together.
Which OpenBB functions are most useful for a country research tracker?
A compact workflow can start with obb.equity.price.historical() for ETF prices, obb.currency.price.historical() for FX history, obb.economy.country_profile() for macro snapshots, obb.economy.calendar() for upcoming releases, and obb.etf.countries() to verify ETF exposure.[^1][^2][^3][^4][^11] OpenBB also documents country-level interest-rate data through obb.economy.interest_rates(), though coverage can vary by market.[^12]
What country ETFs can serve as starting proxies for India, Vietnam, Indonesia, and Mexico?
A practical starter set is INDA for India, EIDO for Indonesia, EWW for Mexico, and VNM for Vietnam.[^6][^7][^8][^9] But they are starting points, not perfect representations. Review liquidity, concentration, and index methodology before treating them as clean signals.
What is the minimum viable macro slate for comparing countries?
For most self-directed investors, a small standardized set works better than a sprawling dashboard: inflation, policy rate, GDP growth, unemployment, and a rates or yield proxy. The goal is not to capture every datapoint. It is to build a repeatable regime snapshot you can maintain weekly.[^1][^12]
How should investors use the economic calendar in this workflow?
Use it to monitor what could change the story next. Track the next 7 to 14 days of inflation, interest-rate, GDP, labour, trade, and business releases by country and importance. OpenBB’s economic calendar is built for that kind of catalyst review.[^4]
Can this workflow be automated?
Yes, but automation should come second. Build a manual process you trust first, then schedule recurring data pulls, notebook refreshes, exports, and scorecard updates using the same documented OpenBB endpoints.[^1][^2][^4][^11]
What are the biggest limitations of country ETF proxies?
Single-country ETFs can be concentrated, sector-skewed, and incomplete as representations of the local economy. That problem matters even more in smaller or less accessible markets like Vietnam, where the ETF may be useful for screening but still imperfect as a full expression of the opportunity set.[^9]
Does OpenBB support country-level macro comparison well enough for this use case?
Yes, with caveats. OpenBB documents a country-profile endpoint with country statistics and indicators, a global economic calendar, ETF country-weighting data, and country-level interest-rate data, which together make it well suited to a lightweight country tracker.[^1][^3][^4][^12] The main caveat is uneven dataset coverage across some emerging and frontier markets.[^12]